News
Obama takes Hamilton
By Rachel Lieb '13 and Taylor Coe '13
November 1, 2012
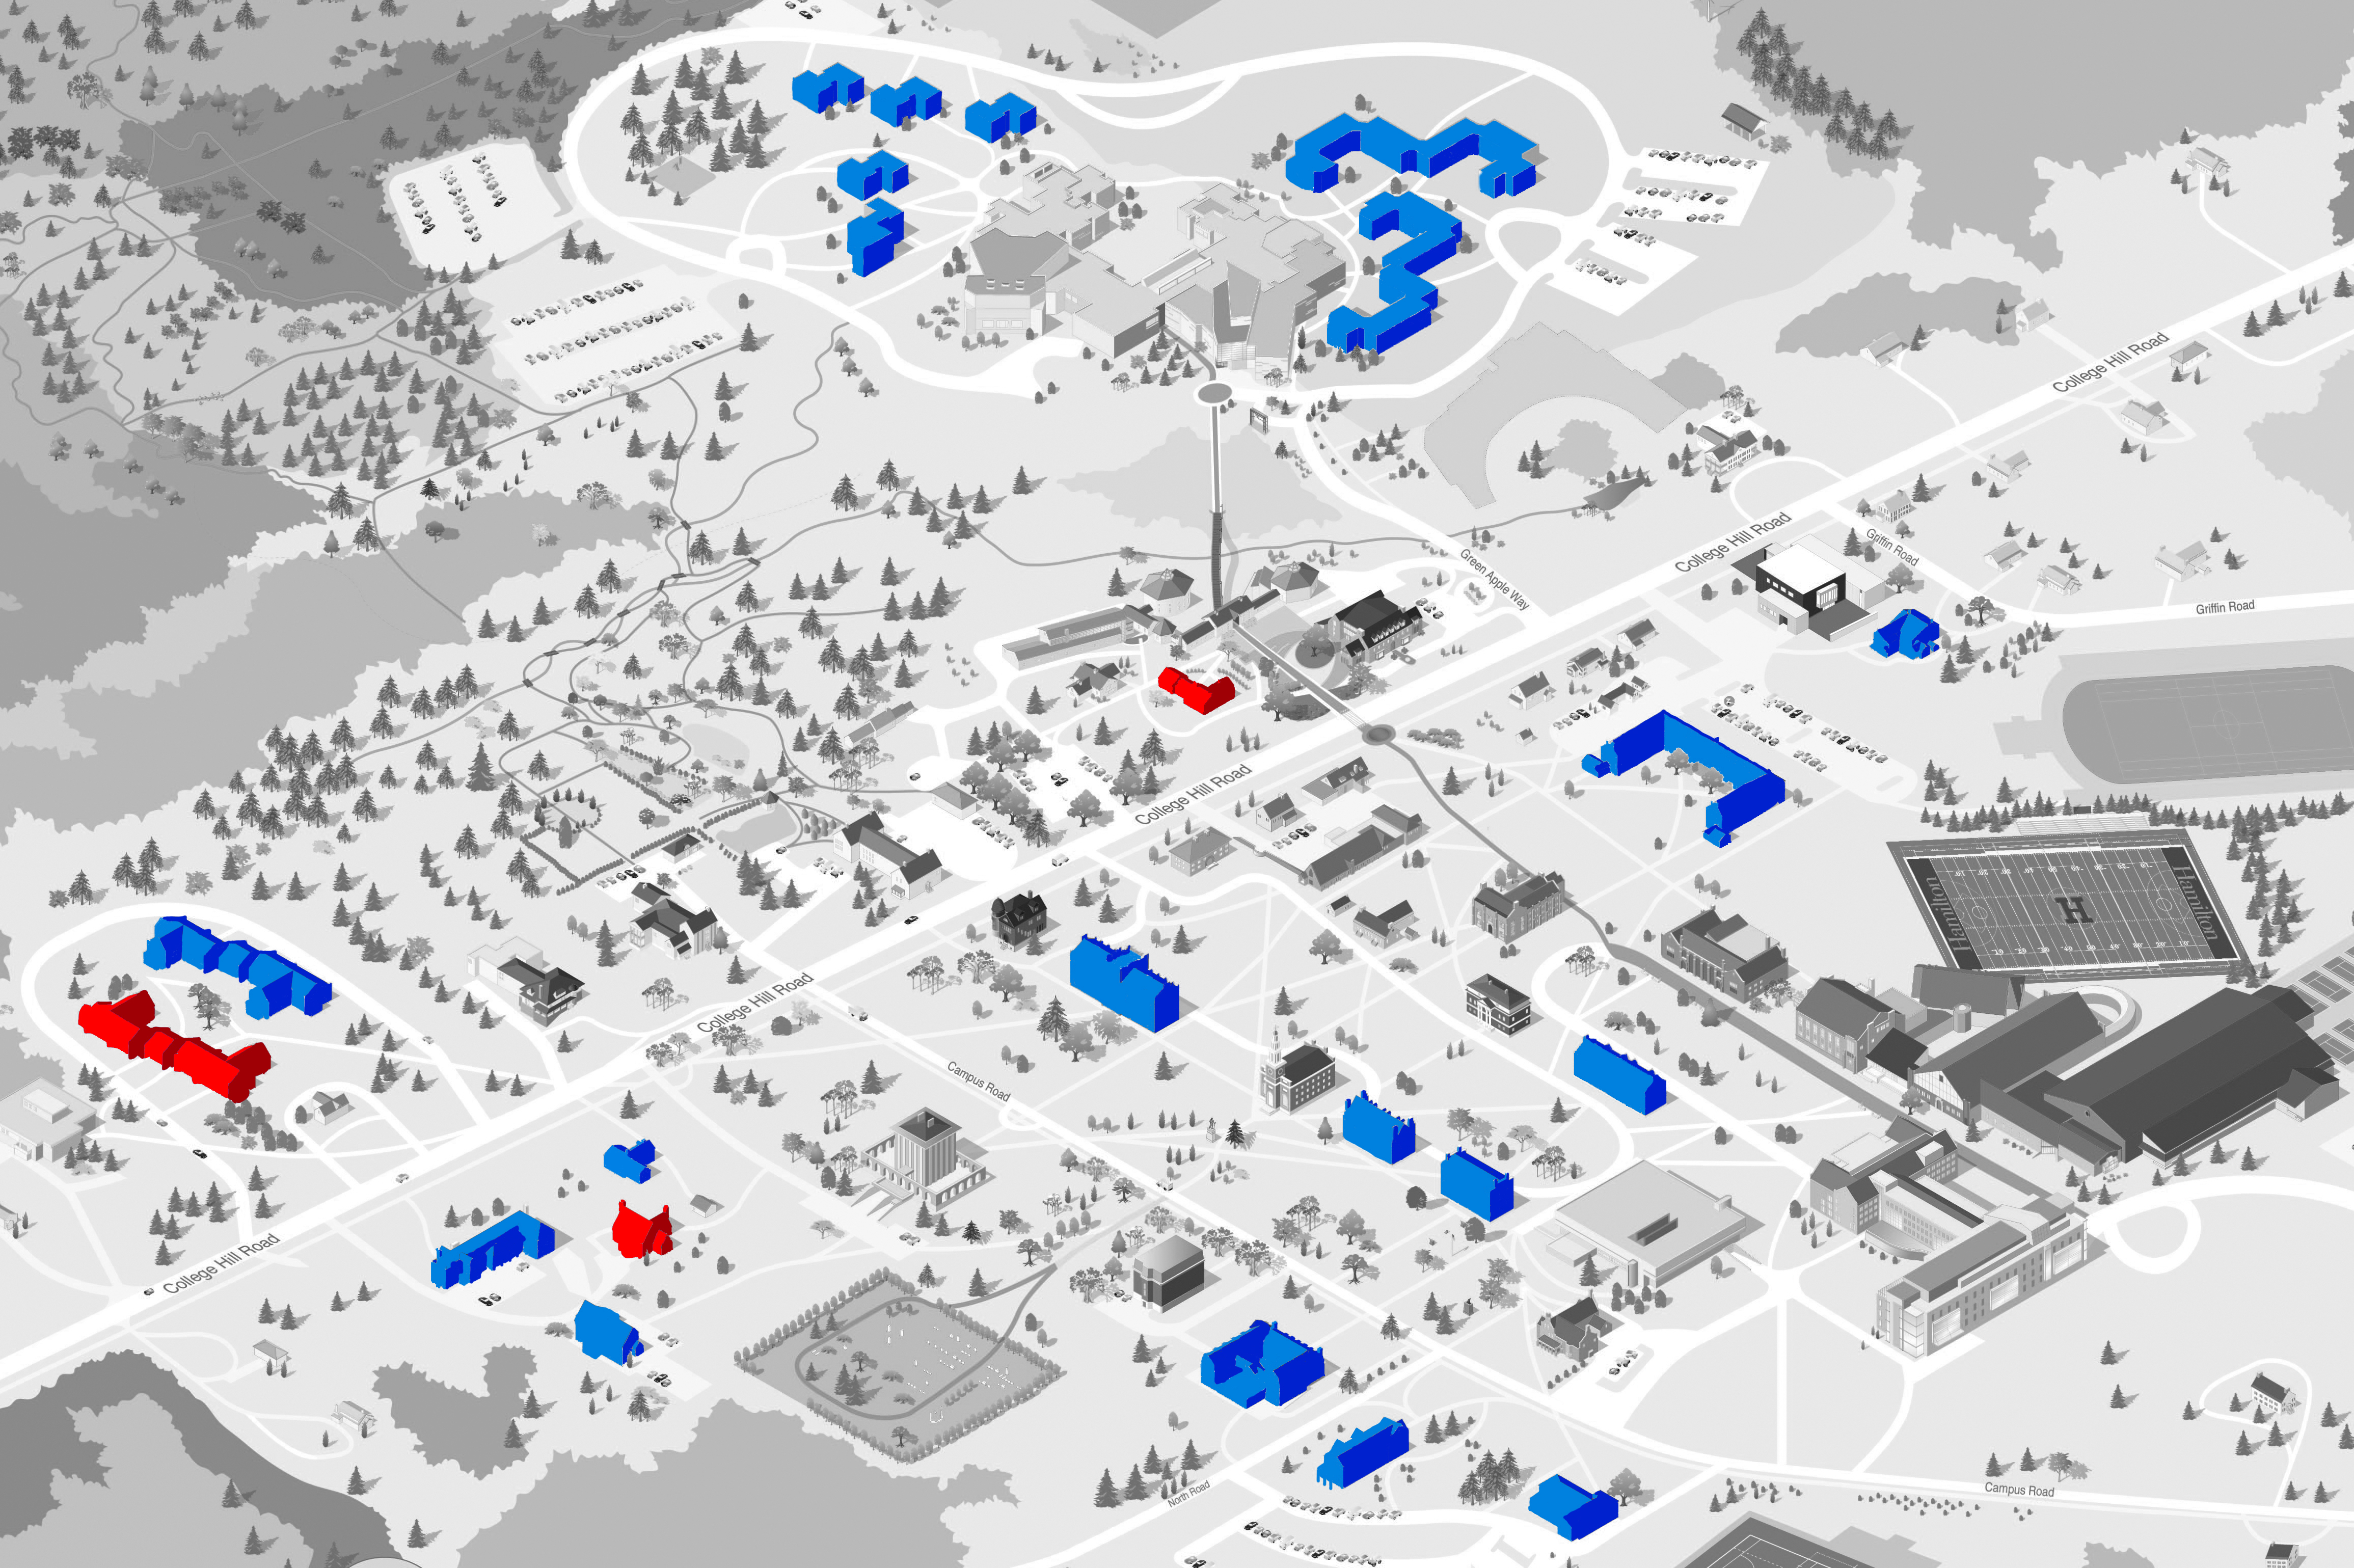
Didn’t we see this one coming? After all, it’s an old joke that all college campuses are liberal; Hamilton is no exception to the rule. Polling students, faculty and staff, we compiled three ‘electoral college’ maps of the campus hoping to tease out relationships between those who either work for, teach at or attend Hamilton and the spectrum of voting choices this election.
We have affiliated dorms and buildings on campus with political parties—blue for Democrats, red for Republicans and green for ‘other’—based on the votes we received from a poll we sent to the community last week. The votes by no means reflected the actual population on campus. 521 students, or 28.3% of the total student body responded, 49 professors or 21.1% of faculty responded and a mere 88 of the 434 staff members and administrators, or 20.2%, responded to the poll, sent via e-mail and posted on various Spectator staffers’ Facebook pages. Maps that represent the faculty and staff electoral distribution can be found on page two.
Particular dorms and departments had much better response rates than others. Babbitt Hall had the most residents participate in the poll, with 45% responding. Sixty of Babbitt’s 160 residents voted for President Obama, seven for Governor Romney and five chose the ‘other’ option.
The Anderson-Connell Alumni Center had the greatest participation in the staff and administrator category, with 20 people voting. Though they have the largest portion of faculty offices, the Kirner-Johnson building had the highest number of participants with 13 faculty members responding.
However, just like the real electoral map, our three maps of campus do not tell the whole story: there are votes (and voters) that have disappeared. For most of the solid-colored buildings you see on these maps, there are votes for other candidates that the majority has swallowed up. Many of the votes not reflected on the maps are Republican. For further thoughts on the imbalance of political opinion on the campus (in startling contrast to national polling numbers), see the opinion article on page 11 by Kayla Safran ’13.
A secondary lesson lurking in the survey results is that of e-mail apathy. Hamilton students, faculty and staff receive a bulk amount of e-mail every day. The inbox of every Hamilton community member sees notices, meetings, lectures, events, warnings, memorandums, reminders and surveys, and these comprise merely the listserv e-mails, overlooking the personal e-mails that are shuffled in amongst the rest.
For campus-wide surveys, e-mail apathy is an expected threat; a survey will never receive anything even close to a 100% response rate.
In contrast with our survey, the CAB spring concert survey has received 1,017 responses so far, despite being sent out two days afterward.
“I think Hamilton’s really apathetic,” said William Rusche ’13, president of the Hamilton College Democrats, in an article from the Sept. 20 issue of The Spectator in regard to politics on campus. With respect to these two surveys, Rusche seems to be correct.
The staff survey at right is interesting for a few reasons. Despite going for ‘other’ on the map, there were only three responses received from Physical Plant: two for ‘other’ and one for Romney/Ryan.
There are only two buildings on the staff map that went for Romney/Ryan, but, again, the numbers are misleading; only one vote from each was received.
Of the 88 responses from staff, 66 were votes for Obama/Biden, 17 were voters for Romney/Ryan and 5 were votes for ‘other.’
The high numbers for Obama among the College staff are surprising, given that this area of New York State has traditionally gone Republican in elections.
The position of Oneida County Executive has been in Republican hands since 1980, currently held by Anthony J. Picente, Jr. The Oneida County Board of Legislators is composed of 16 Republicans and 13 Democrats. Several representatives from Clinton, Utica, Rome and New Hartford are Republican.
Joseph Griffo, the state senator for District 47 in New York State, in which Clinton is located, is also a Republican.
No one should be surprised by the lack of red on the Hamilton faculty map. It’s no secret that collegiate culture—especially the faculty—sways liberal.
Out of 49 faculty responses to the survey, 43 votes were for Obama/Biden, 5 were for Romney/Ryan and 1 was for ‘other.’
In a study released five years ago by Neil Gross, an assistant professor of sociology at Harvard, and Solon Simmons, an assistant professor of sociology and conflict analysis at George Mason University, the stereotype was grounded in some real numbers.
Polling 1,417 full-time professors, Gross and Simmons found that 44.1% identified themselves as liberal, 46.1% as moderate and 9.2% as conservative.
In a similar survey by the Washington Post, 72% of the polled professors identified themselves as liberal and 15% as conservative. The survey also found that the divergence is even greater at so-called ‘elite schools,’ such as Hamilton, at which 87% of professors identify as liberal and only 13% as conservative.
No comments yet.
Comment Guidelines
Please log in to post a comment